
How to Identify Your True Operational Bottlenecks with Data
We have all been in that meeting.
The one where the Head of Sales insists that "Operations cannot fulfil orders fast enough," while the VP of Operations counters that "Engineering's buggy releases are creating a support nightmare," and Engineering is waiting on "slow feedback from Product."
It is the operational blame game. It is exhausting, unproductive, and ultimately, it fails to solve the core problem. Why? Because it is based on anecdotes rather than evidence.
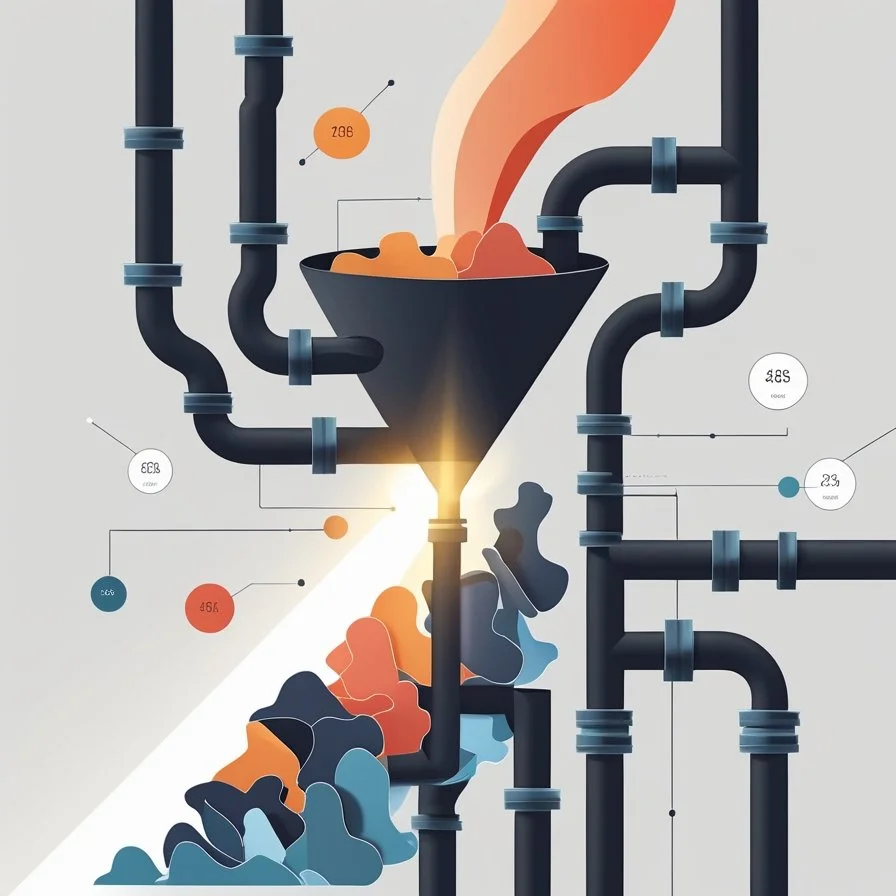
The loudest voice or the most visible symptom often gets the blame, while the true bottleneck, the single biggest constraint limiting your entire system's throughput, remains hidden. It continues to drain efficiency, profit, and morale.
The escape route from this cycle is not a better mediator; it is better data.
Why Your Gut Is a Terrible Bottleneck Detective
Human intuition is brilliant in many contexts, but it isn't good at diagnosing complex, interconnected systems. We are wired to see patterns where none exist and to conflate correlation with causation.
The Proximity Bias: We blame what we can see. The slow assembly line is the assembler's fault, right? Not if the root cause is a delayed parts delivery from a supplier or a poorly designed workflow from two steps prior.
The Symptom vs. The Disease: A backlog in customer support is a symptom. The disease could be a flawed product, unclear documentation, or an inefficient ticketing system. Treating the symptom, such as hiring more support agents, is costly and does not cure the patient.
To find the real constraint, you need to remove emotion and opinion from the equation. You need to let the data tell the story.
The 3-Step Data-Driven Diagnosis
Shifting from a culture of blame to one of diagnosis requires a structured approach. Here is how to start.
Step 1: Map Your Value Stream
Before you can measure anything, you need to know what you are measuring. A Value Stream Map is a simple but powerful visual tool that diagrams the flow of a single unit, like an order or a customer, from request to delivery.
Do not overcomplicate this. Start with a whiteboard or a Miro board and map the major stages. For an e-commerce company, this might look like: Customer Order to Payment Processing to Inventory Check to Picking and Packing to Handoff to Courier to Delivery.
The goal is to make the entire process visible to everyone.
Step 2: Uncover the Reality with Data Collection
Your map represents the theory of your operation. Now, you must uncover the reality. This is a data collection phase where you gather the empirical evidence for how each stage performs.
Become a detective for each process step and collect evidence on:
Its Speed: Track both active work time, which is Cycle Time, and total time including delays, which is Lead Time.
Its Capacity: Measure how much it can output, known as Throughput.
Its Accuracy: Calculate how often it creates errors that cause rework or delays downstream, your Error Rate.
This evidence gathering turns guesses into facts and lays the groundwork for your breakthrough.
Step 3: Analyse the Constraint
Now, plot this data against your value stream map. The constraint, the true bottleneck, will reveal itself. It is the stage with one or more of the following characteristics:
The longest cycle time relative to the others.
The lowest throughput.
The highest error or rework rate causes blocks and delays for downstream stages.
A consistent work-in-progress backlog piled up in front of it.
The pivotal moment: You might discover that the "slow shipping" everyone complains about is actually caused by a bottleneck in "payment processing" that delays orders from ever reaching the warehouse. The data does not lie.
From Diagnosis to Cure
Identifying the bottleneck is most of the battle. Now you can focus your improvement efforts with surgical precision.
Instead of a company-wide "we need to be faster" initiative, you can launch a targeted project to "reduce the cycle time of the payment verification stage by fifty percent."
Instead of blaming the warehouse team, you can collaboratively solve the data-identified problem in the finance department's process.
This objective approach depersonalises the problem and unites the team around a common, data-backed goal.
The First Step Towards an Intelligent Operation
This foundational practice of using data to diagnose bottlenecks is also the essential prerequisite for implementing more advanced solutions, like AI. You cannot automate or intelligently optimise a process you do not understand.
By building this muscle for data-driven diagnosis, you are not just solving today's biggest bottleneck. You are building a more resilient, agile, and intelligent organisation. You are creating a company that is primed to leverage AI not as a magic wand, but as the next logical tool in its continuous improvement arsenal.
Stop playing the blame game. Start listening to your data.